Free indicator
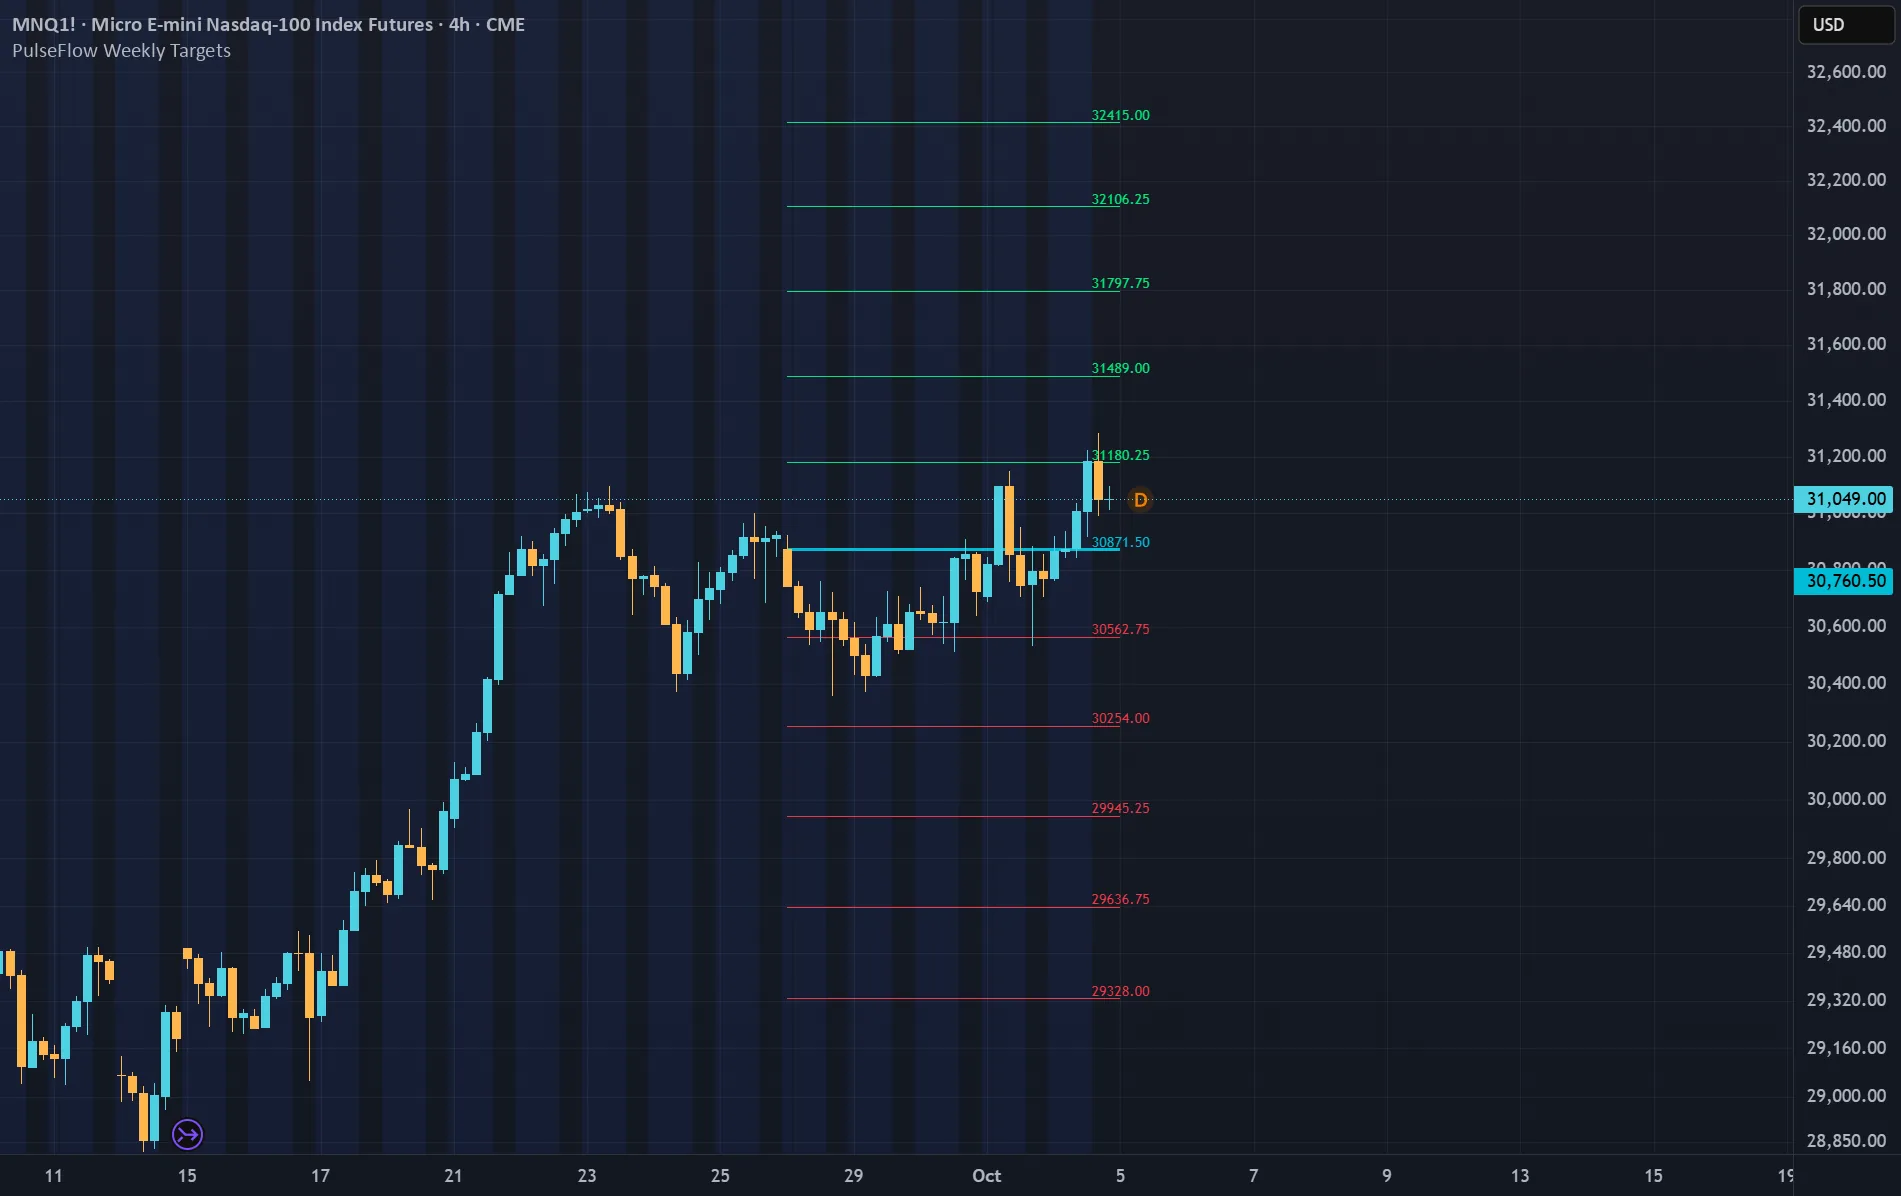
Every week opens with a map.
Weekly Opening Targets ±5% is a free indicator that draws the percentage targets institutional traders work with, measured from the weekly open. It shows you where price reacts according to institutional objectives.
Where the levels come from
Institutional traders, from funds to banks to trading desks, plan and measure their trades in percentages from the opening price of the year, the week and the day. Those distances are their targets, the places where they take profits, close or adjust positions and manage risk. That is why price so often reacts at these percentage levels. This indicator draws the weekly ones for you.
New to this?
The opening price is simply where the market starts the week. A percentage level is a line set a fixed distance above or below it. Imagine the week opens at 100: the +1% line sits at 101 and the -1% line at 99. Now picture that ladder rising to +5% and falling to -5%.
What you see
The weekly open in aqua as your fixed reference, green targets above and red below, by default in 1% steps, each able to show its price. Interval and maximum deviation are adjustable, narrower or wider to fit the asset and its volatility. A new set starts every week and the current levels extend as the week develops. Keep previous weeks, choose how many, and set the line thickness.
Picture your week
It is Tuesday and price pushes toward the +2% line. You look back: how did earlier weeks behave at that same expansion? You read reaction areas, support, resistance and confluence, and you carry that context into your swing or intraday decisions. The levels are references, not automatic signals.
It is not magic. It is institutional behavior.
Free access.
View on TradingView ↗Weekly Opening Targets ±5% is a free indicator that draws the percentage targets institutional traders work with, measured from the weekly open. It shows you where price reacts according to institutional objectives.
Where the levels come from
Institutional traders, from funds to banks to trading desks, plan and measure their trades in percentages from the opening price of the year, the week and the day. Those distances are their targets, the places where they take profits, close or adjust positions and manage risk. That is why price so often reacts at these percentage levels. This indicator draws the weekly ones for you.
New to this?
The opening price is simply where the market starts the week. A percentage level is a line set a fixed distance above or below it. Imagine the week opens at 100: the +1% line sits at 101 and the -1% line at 99. Now picture that ladder rising to +5% and falling to -5%.
What you see
The weekly open in aqua as your fixed reference, green targets above and red below, by default in 1% steps, each able to show its price. Interval and maximum deviation are adjustable, narrower or wider to fit the asset and its volatility. A new set starts every week and the current levels extend as the week develops. Keep previous weeks, choose how many, and set the line thickness.
Picture your week
It is Tuesday and price pushes toward the +2% line. You look back: how did earlier weeks behave at that same expansion? You read reaction areas, support, resistance and confluence, and you carry that context into your swing or intraday decisions. The levels are references, not automatic signals.
It is not magic. It is institutional behavior.
Free access.
How to get it
Free with a PulseFlow account. Create your account, save your exact TradingView username and we grant access within 24 hours. The indicator then appears in TradingView under Invite-only scripts in your Indicators menu.
Create a free account