Free indicator
Not every 90 minutes moves the same. Know which kind you are in.
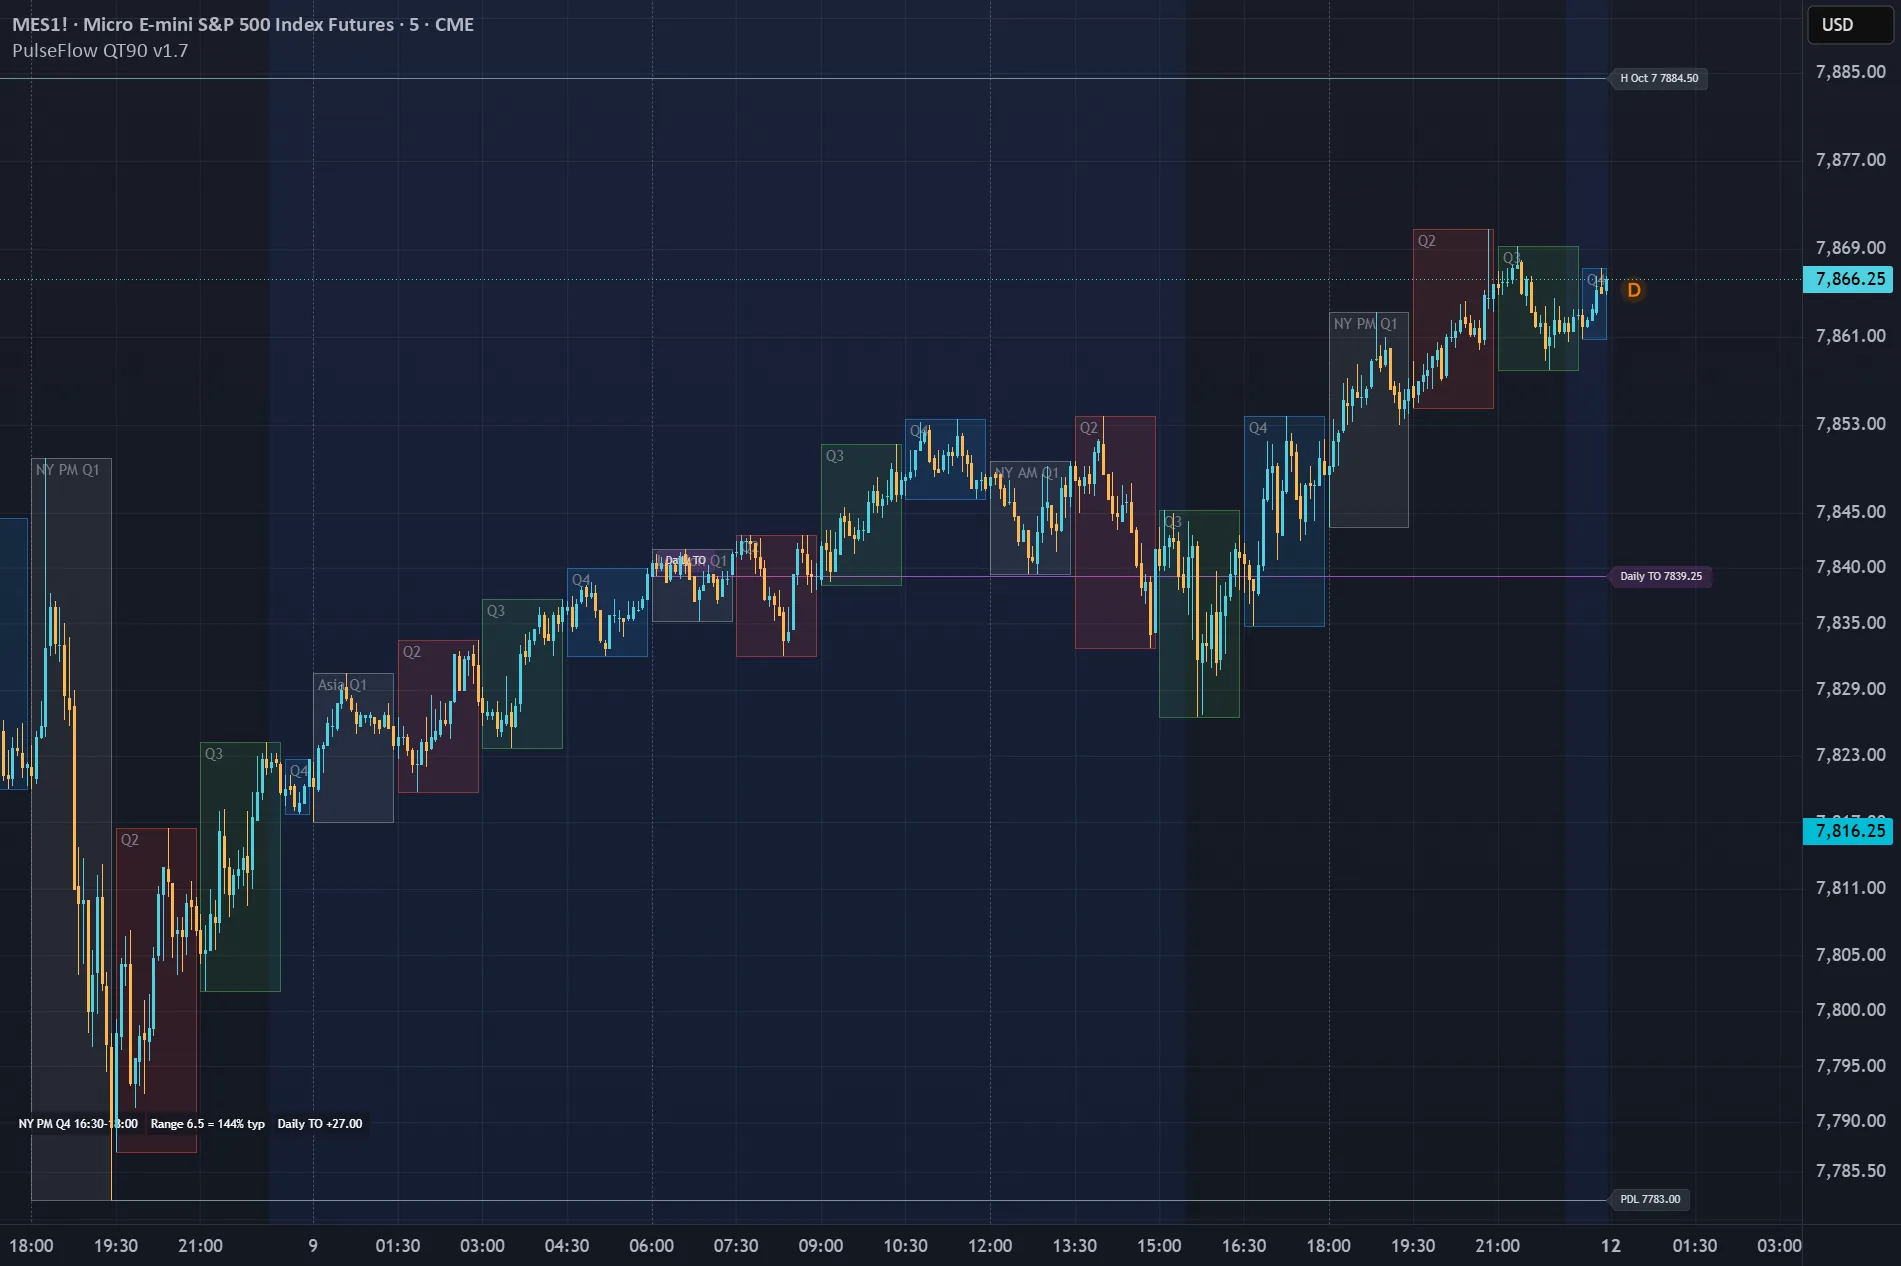
PulseFlow Quarterly Theory 90m Cycles is a free TradingView indicator for equity index futures (NQ, ES, YM, RTY and their micro contracts). It draws the Quarterly Theory clock on your chart and shows how much each 90-minute quarter usually moves.
Built on the part that holds up
The Quarterly Theory, popularized by Daye, starts the trading day at 18:00 New York time and splits it into four 6-hour sessions (Asia, London, NY AM and NY PM), each made of four 90-minute quarters. Many readings of the theory try to tell where price will go next. In our own tests on index futures, that part did not hold up. What did hold up, again and again, is that each quarter of the day has its own typical amount of movement. This indicator is built only on that part: how much, not where.
What you see
A shaded box for each quarter, labelled Q1 to Q4, with the session name on Q1 and dotted lines between sessions. The daily True Open, the price at 00:00 New York time, as a purple line. The highs and lows of previous days that price has not touched yet: PDH and PDL for yesterday, H and L with the date for older days, each removed as soon as price trades through it. Two dotted lines on the current quarter mark where its range would reach its typical size; they hide once it has moved its usual amount.
Context in one row
A one-row panel at the bottom left shows the current quarter with its New York times, its range so far against its typical range, and the distance to the daily True Open. Hover over a cell for the details. An optional 4 x 4 heatmap shows the typical range of all 16 quarters, from the calmest to the busiest. One alert tells you when each new quarter begins.
Good to know
Made for futures charts with extended hours: on regular-hours charts or cash indices, the True Open and the early quarters are missing. The full view works on 1, 2, 3, 5, 6, 9, 10 and 15-minute charts; above that and up to the daily chart it shows only the untouched highs and lows. The typical range describes past quarters, not the future, and does not account for news days. No buy or sell calls, entries, stops or targets.
Know the clock. Keep the decisions. Free access.
View on TradingView ↗PulseFlow Quarterly Theory 90m Cycles is a free TradingView indicator for equity index futures (NQ, ES, YM, RTY and their micro contracts). It draws the Quarterly Theory clock on your chart and shows how much each 90-minute quarter usually moves.
Built on the part that holds up
The Quarterly Theory, popularized by Daye, starts the trading day at 18:00 New York time and splits it into four 6-hour sessions (Asia, London, NY AM and NY PM), each made of four 90-minute quarters. Many readings of the theory try to tell where price will go next. In our own tests on index futures, that part did not hold up. What did hold up, again and again, is that each quarter of the day has its own typical amount of movement. This indicator is built only on that part: how much, not where.
What you see
A shaded box for each quarter, labelled Q1 to Q4, with the session name on Q1 and dotted lines between sessions. The daily True Open, the price at 00:00 New York time, as a purple line. The highs and lows of previous days that price has not touched yet: PDH and PDL for yesterday, H and L with the date for older days, each removed as soon as price trades through it. Two dotted lines on the current quarter mark where its range would reach its typical size; they hide once it has moved its usual amount.
Context in one row
A one-row panel at the bottom left shows the current quarter with its New York times, its range so far against its typical range, and the distance to the daily True Open. Hover over a cell for the details. An optional 4 x 4 heatmap shows the typical range of all 16 quarters, from the calmest to the busiest. One alert tells you when each new quarter begins.
Good to know
Made for futures charts with extended hours: on regular-hours charts or cash indices, the True Open and the early quarters are missing. The full view works on 1, 2, 3, 5, 6, 9, 10 and 15-minute charts; above that and up to the daily chart it shows only the untouched highs and lows. The typical range describes past quarters, not the future, and does not account for news days. No buy or sell calls, entries, stops or targets.
Know the clock. Keep the decisions. Free access.
How to get it
Free with a PulseFlow account. Create your account, save your exact TradingView username and we grant access within 24 hours. The indicator then appears in TradingView under Invite-only scripts in your Indicators menu.
Create a free account