Premium indicator
Spot the big swings. Keep your days.
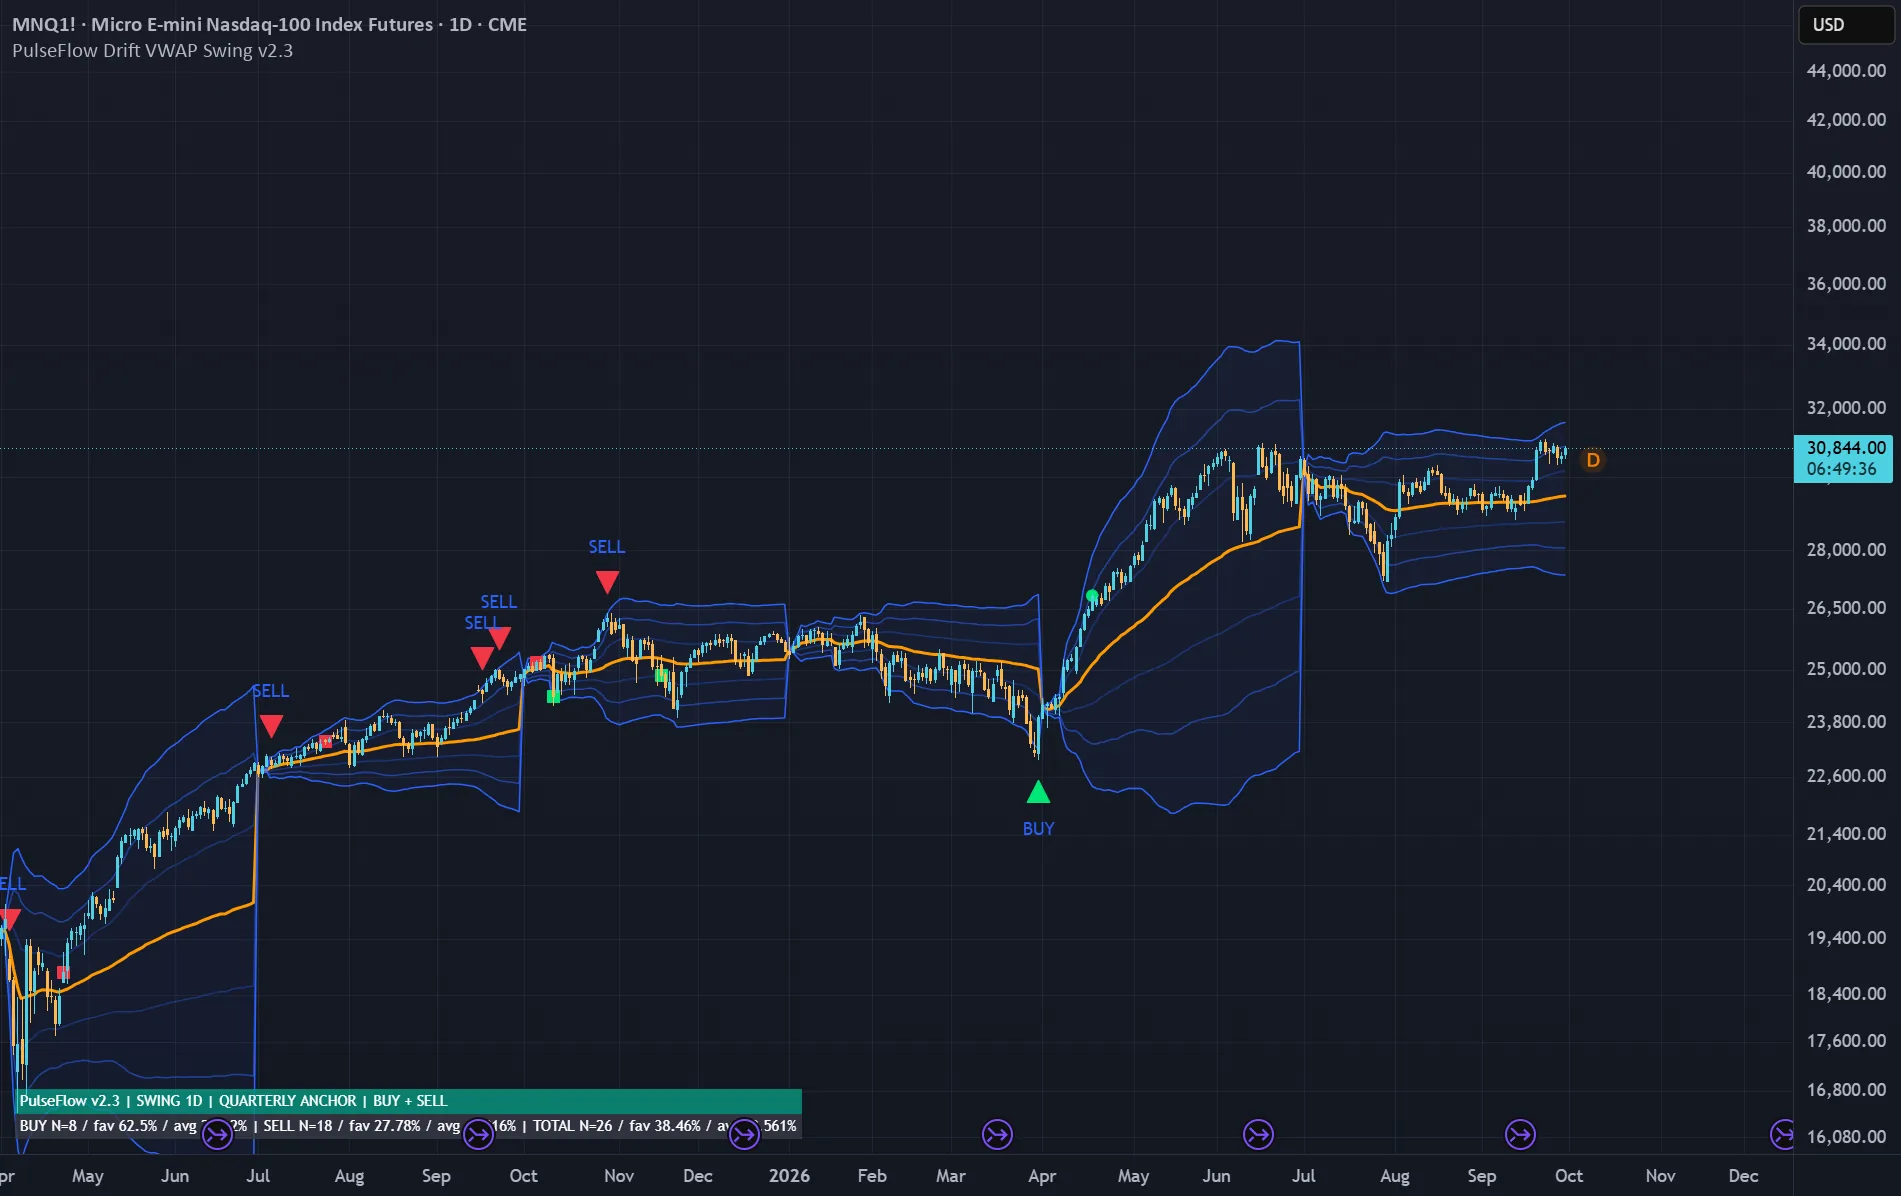
PulseFlow Drift VWAP Swing is a TradingView indicator for swing traders on daily and weekly charts. It draws the average price of the quarter or the year, then marks a BUY or a SELL when price has stretched far away and starts to come back.
Picture a rubber band
Stretch it far and it wants to go home. Markets behave in a similar way: a big move away from the average does not last forever, and at some point the market pauses or turns. This indicator shows you those moments.
The average, in plain words
VWAP is the average price the market has paid, where busy candles count more than quiet ones. It is built from the chart's own candles and volume, and restarts each quarter on daily charts and each year on weekly ones (configurable). Three bands above and below show how stretched price is.
Then it shows its homework
A set number of candles after each signal, a marker appears: a circle for buys, a square for sells, green if price moved in the signal's favour, red if not. They are not exits. A compact panel on the left counts buys, sells and the total, with the share that moved favourably and the average move. Hover to compare it with how often price rose over the same number of candles across your symbol's whole history. Your chart, your own evidence.
Once a day. Or once a week.
Picture a Sunday morning with coffee. You open the weekly chart, see whether a mark has appeared and get on with your life. Or an alert arrives as a daily candle closes and the chart taps your shoulder.
You stay in charge
Read signals with the trend: favour buys when the market is rising and sells when it is falling. Judging the trend is your call. Show buys, sells or both. Each signal is a place to study, not an order. Works on any market with volume data, crypto included.
Daily and weekly charts only (for intraday, there is PulseFlow Drift VWAP Intraday). Signals are confirmed at the candle close, and the panel shows descriptive observations, not a backtest.
Spot the big swings. Keep your days. PulseFlow Premium access.
View on TradingView ↗PulseFlow Drift VWAP Swing is a TradingView indicator for swing traders on daily and weekly charts. It draws the average price of the quarter or the year, then marks a BUY or a SELL when price has stretched far away and starts to come back.
Picture a rubber band
Stretch it far and it wants to go home. Markets behave in a similar way: a big move away from the average does not last forever, and at some point the market pauses or turns. This indicator shows you those moments.
The average, in plain words
VWAP is the average price the market has paid, where busy candles count more than quiet ones. It is built from the chart's own candles and volume, and restarts each quarter on daily charts and each year on weekly ones (configurable). Three bands above and below show how stretched price is.
Then it shows its homework
A set number of candles after each signal, a marker appears: a circle for buys, a square for sells, green if price moved in the signal's favour, red if not. They are not exits. A compact panel on the left counts buys, sells and the total, with the share that moved favourably and the average move. Hover to compare it with how often price rose over the same number of candles across your symbol's whole history. Your chart, your own evidence.
Once a day. Or once a week.
Picture a Sunday morning with coffee. You open the weekly chart, see whether a mark has appeared and get on with your life. Or an alert arrives as a daily candle closes and the chart taps your shoulder.
You stay in charge
Read signals with the trend: favour buys when the market is rising and sells when it is falling. Judging the trend is your call. Show buys, sells or both. Each signal is a place to study, not an order. Works on any market with volume data, crypto included.
Daily and weekly charts only (for intraday, there is PulseFlow Drift VWAP Intraday). Signals are confirmed at the candle close, and the panel shows descriptive observations, not a backtest.
Spot the big swings. Keep your days. PulseFlow Premium access.
How to get it
Included in PulseFlow Premium, together with every other indicator. Premium opens as soon as payments are enabled, at a planned price of 29 € per month. Join the waitlist and you will hear from us first.
Join the Premium waitlistOpens an email to contact@pulseflowindicators.com. Add your TradingView username.