Premium indicator
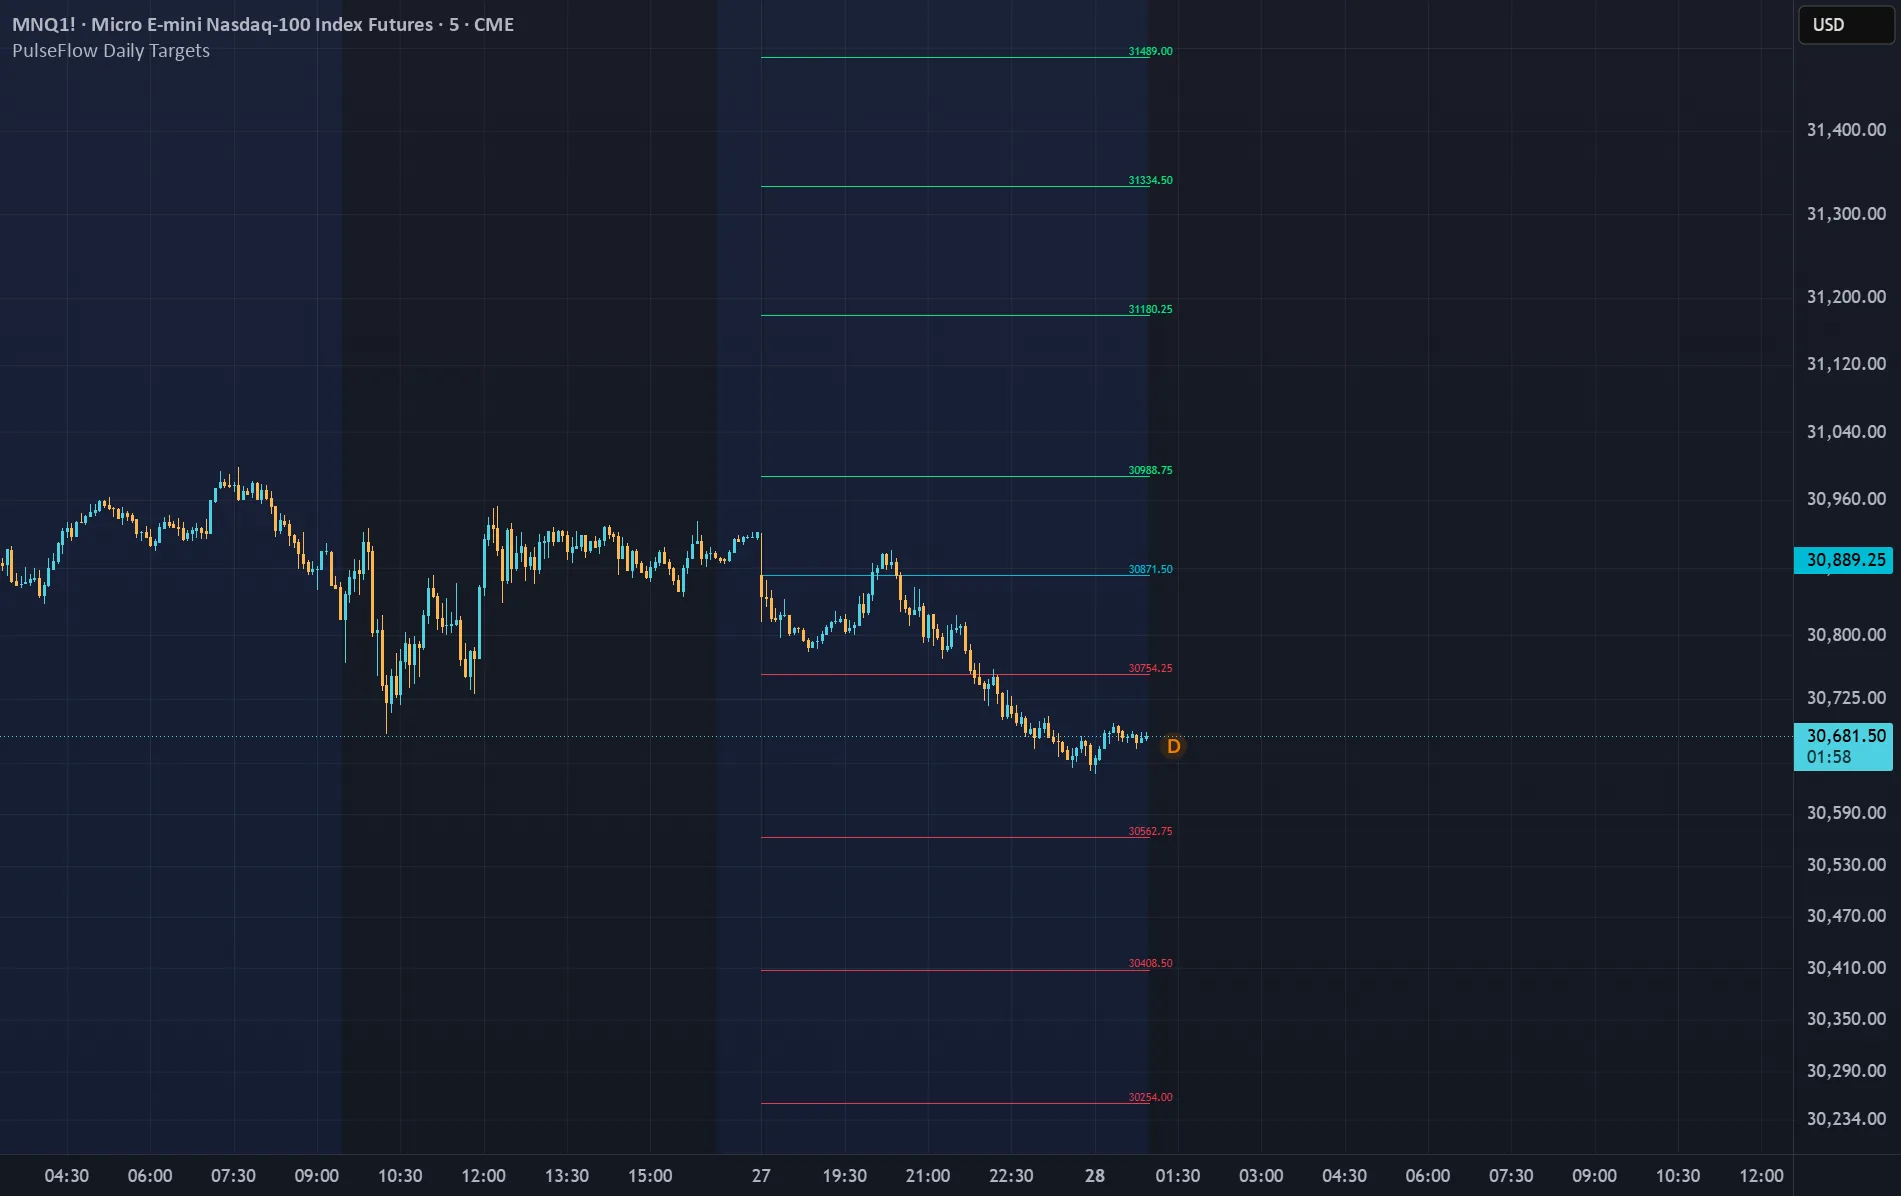
The day opens. The institutional targets are already on your chart.
Daily Targets is a premium indicator for intraday and daily analysis. From today's opening price it draws the percentage targets institutional traders use for the session, so you see where price reacts according to institutional objectives.
Why these levels
The opening price is the first price of the day. Funds, banks and trading desks plan and measure their trades in percentages from the opening price of the year, the week and the day: plus 1%, minus 1.5%. Those distances work as their targets, where they take profits, close or adjust positions and manage risk. That is why price so often reacts at these levels.
What you get
An aqua line at the day open, four green targets above it and four red below. By default they sit at ±0.38%, ±1%, ±1.5% and ±2%, and all four distances are configurable to fit your asset and its volatility. Price labels take the color of their line, with no boxes covering your candles, so you read the exact price of every target.
A fresh map each morning
Each trading day the indicator takes the new open and calculates a new set of targets. The lines grow with each candle and stop when the day ends, so one day never ties into the next. Keep previous days to compare (30 by default, up to 50) or show only today.
Picture the session
Price opens, climbs and stalls at the first green line. Does it reject the level or accept it and keep going? You watch a level that matters, see how far the session has travelled and where it meets structure, VWAP, volume, support or resistance. These levels are references, not automatic entries or exits.
It is not magic. It is institutional behavior.
PulseFlow Premium access.
View on TradingView ↗Daily Targets is a premium indicator for intraday and daily analysis. From today's opening price it draws the percentage targets institutional traders use for the session, so you see where price reacts according to institutional objectives.
Why these levels
The opening price is the first price of the day. Funds, banks and trading desks plan and measure their trades in percentages from the opening price of the year, the week and the day: plus 1%, minus 1.5%. Those distances work as their targets, where they take profits, close or adjust positions and manage risk. That is why price so often reacts at these levels.
What you get
An aqua line at the day open, four green targets above it and four red below. By default they sit at ±0.38%, ±1%, ±1.5% and ±2%, and all four distances are configurable to fit your asset and its volatility. Price labels take the color of their line, with no boxes covering your candles, so you read the exact price of every target.
A fresh map each morning
Each trading day the indicator takes the new open and calculates a new set of targets. The lines grow with each candle and stop when the day ends, so one day never ties into the next. Keep previous days to compare (30 by default, up to 50) or show only today.
Picture the session
Price opens, climbs and stalls at the first green line. Does it reject the level or accept it and keep going? You watch a level that matters, see how far the session has travelled and where it meets structure, VWAP, volume, support or resistance. These levels are references, not automatic entries or exits.
It is not magic. It is institutional behavior.
PulseFlow Premium access.
How to get it
Included in PulseFlow Premium, together with every other indicator. Premium opens as soon as payments are enabled, at a planned price of 29 € per month. Join the waitlist and you will hear from us first.
Join the Premium waitlistOpens an email to contact@pulseflowindicators.com. Add your TradingView username.