Premium indicator
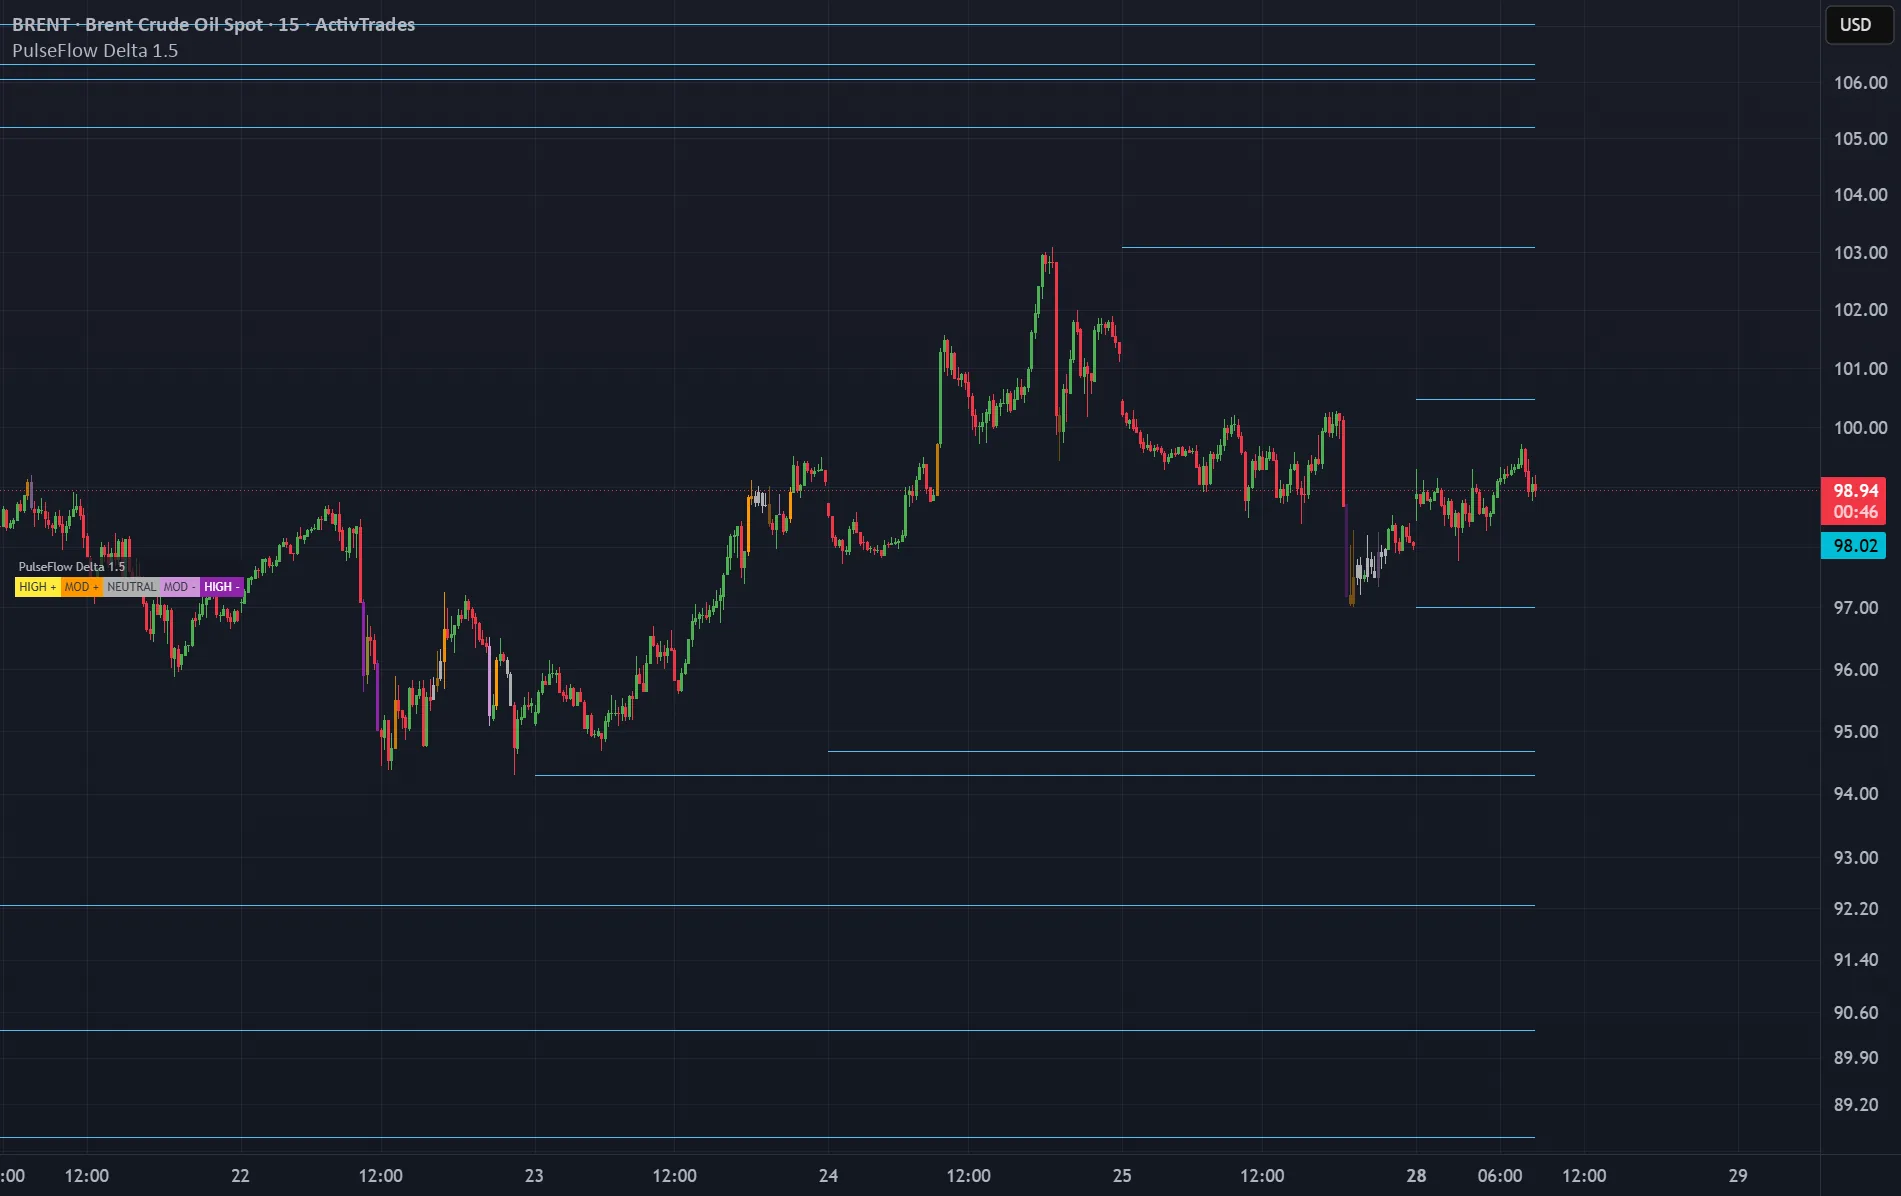
Yesterday's high and low are where breakouts are attempted. What matters is who shows up when price gets there.
PulseFlow Breakout Delta highlights every candle that tests the previous day's high or low and shows at a glance whether buyers or sellers controlled that contact, and how intense it was.
What's behind every touch
Candles that reach either level are colored on a scale from strong buying to strong selling, with a compact legend on the chart. The color reflects who dominated, not the candle's direction: a green candle can reveal that sellers were in control. Untested highs and lows stay on the chart until price returns to them, or you can show only the latest day.
Adapt it to your market
Use the symbol's previous day or define your own session, hours and time zone. Adjust the reading's sensitivity, the colors, the legend and whether older levels are shown.
Context at the daily references
Did the test of yesterday's high meet strong buying or strong selling? Did activity pick up at the level, or did price touch it quietly? Combine the reading with your own price analysis. The indicator does not give entries, exits, targets or alerts, and a color does not predict what price will do next.
Requirements
Requires a TradingView Premium or Ultimate plan, which includes the footprint data the indicator reads, and works on standard intraday charts. Activity comes from that data, not from identified traders or orders. Colors on older candles may change slightly when the chart reloads. PulseFlow Premium access.
View on TradingView ↗PulseFlow Breakout Delta highlights every candle that tests the previous day's high or low and shows at a glance whether buyers or sellers controlled that contact, and how intense it was.
What's behind every touch
Candles that reach either level are colored on a scale from strong buying to strong selling, with a compact legend on the chart. The color reflects who dominated, not the candle's direction: a green candle can reveal that sellers were in control. Untested highs and lows stay on the chart until price returns to them, or you can show only the latest day.
Adapt it to your market
Use the symbol's previous day or define your own session, hours and time zone. Adjust the reading's sensitivity, the colors, the legend and whether older levels are shown.
Context at the daily references
Did the test of yesterday's high meet strong buying or strong selling? Did activity pick up at the level, or did price touch it quietly? Combine the reading with your own price analysis. The indicator does not give entries, exits, targets or alerts, and a color does not predict what price will do next.
Requirements
Requires a TradingView Premium or Ultimate plan, which includes the footprint data the indicator reads, and works on standard intraday charts. Activity comes from that data, not from identified traders or orders. Colors on older candles may change slightly when the chart reloads. PulseFlow Premium access.
Requirements: Requires TradingView Premium or Ultimate
How to get it
Included in PulseFlow Premium, together with every other indicator. Premium opens as soon as payments are enabled, at a planned price of 29 € per month. Join the waitlist and you will hear from us first.
Join the Premium waitlistOpens an email to contact@pulseflowindicators.com. Add your TradingView username.